I was exploring the Model Viewer capabilities and was interested in learning more about the potential workflows of this feature. thus I have the following questions:
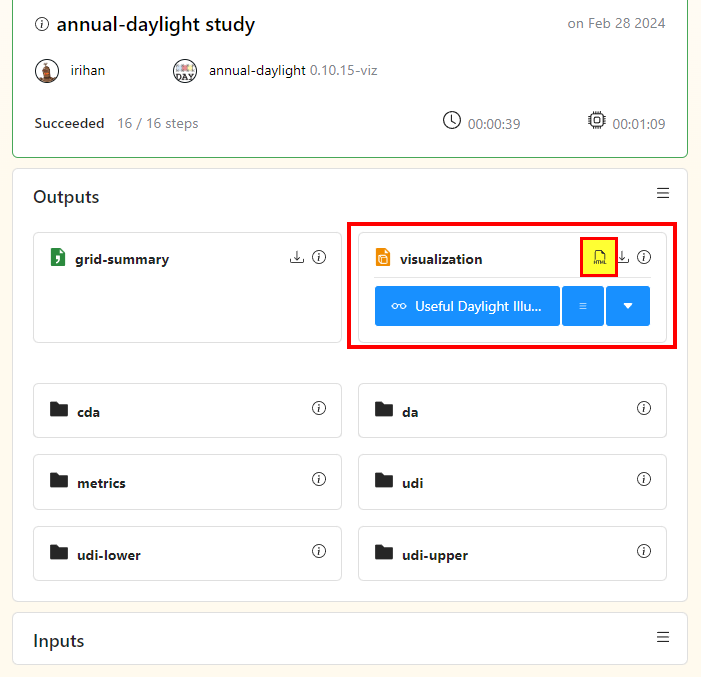
I was wondering if there’s a direct, and local , way to export a HBJSON models (or Visualization Set objects generally) into HTML similar to the already implemented functionality in Pollination Outputs option highlighted here:
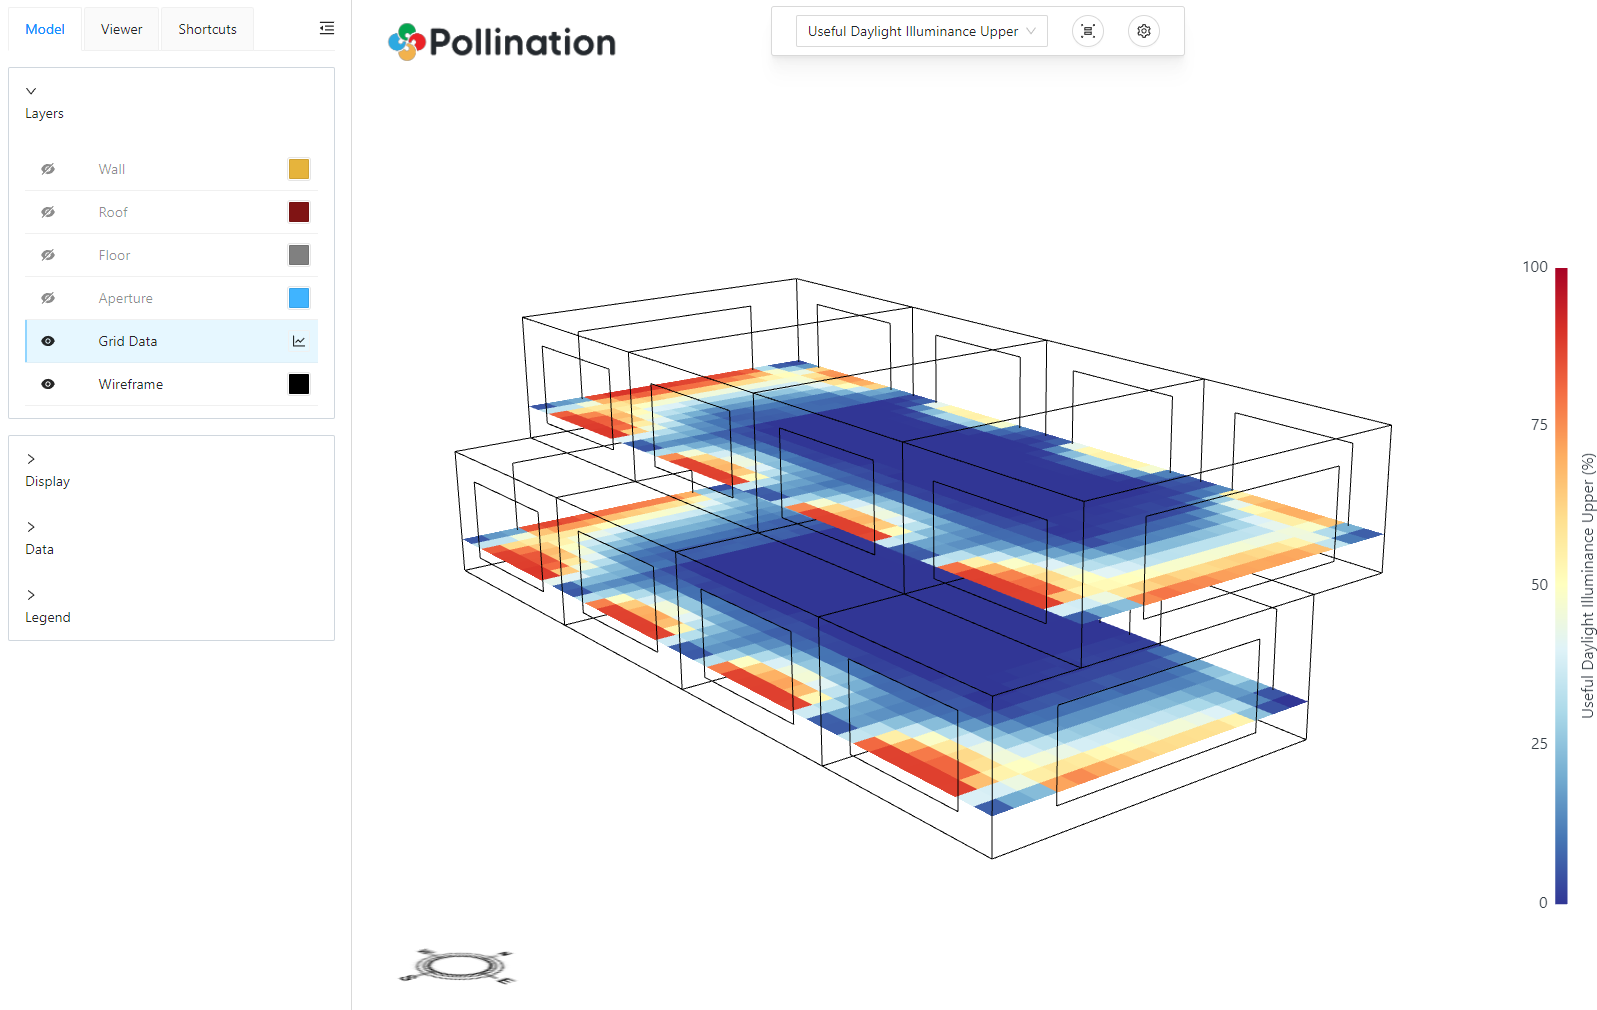
Within the generated HTML viewer file, if one needs to add more features: for instance a user ability to interact and/or investigate parts of visualized result meshes, have custom data callouts (EUIs or face energy for example) while hovering over HB model rooms/elements, or just maybe flip the false-colours that are provided; what would be the appropriate approach to such customization? or where one can start looking at if there is a documentation available?
While doing some tests with honeybee_display and ladybug_display I noticed that legend_parameters for FaceAttribute, RoomAttribute and data of grid_data_path with VisualizationSet do not change colors and value limits.
Do you have an example of how to change these parameters in your code above?
Hi @rkleitzke, I will be happy to help. Can you provide a minimal example that showcases the issue? I don’t remember all the implementation details right now but I can start from an example that doesn’t work, and try to make it work! Thanks.
I can’t upload files because I’m new here, but in summary, when I try to set a colorset(), for example, to change the colors in LegendParameters. The title (Test 1 or Test 2) works, but the colors do not.
In the same way, if I set some path to grid_data_path in model_to_vis_set(), how can I configure the LegendParameters of grids?
But for some reason the viewer ignores them. We will need @antonellodinunzio’s help to fix this. He is on vacation this week and next but I assign this conversation to him so he can have a look once he is back.
Antonello, here is the vtkjs file for your reference.
Sorry that it is taking longer than usual to address this, @rkleitzke but you should continue with the rest of your work knowing that the colors will show up as expected once this issue is addressed.
The issue should be fixed. Try [path-to-python] -m pip install -U honeybee-display[full]. This should install honeybee-display v0.4.0 and ladybug-vtk v0.14.4 which includes the fix.
@mostapha, thank you very much, it is working just fine!
Just a suggestion for a future version: an option to set Legend Parameters Categorized for FaceAttribute and RoomAttribute.
Also, when I create a VisualizationSet with model_to_vis_set, can I set a list of paths to grid_data_path? And has any way to change the legend_par of them?
You can add a path in which there are subfolders. Each subfolder will be added as its own dataset with its own legend. You can see here that it will check if there is a JSON file with visualization metadata in the subfolders (must be named vis_metadata.json). This file will control the legend parameters but also the name of the data type which will be visible in the visualization, e.g., instead of the subfolder name “da” we will change the name to “Daylight Autonomy” in the metadata file.
I have attached an example showing the folder with subfolders. The metadata in the vis_metadata.json files in this example are generated with this function, and here they are written to separate files for each subfolder, but you can of course use an alternative workflow as long as the metadata files are in the subfolders before you run model_to_vis_data().
Thanks, I’m changing the model_to_visualization_set() to model_to_visualization_data() and it makes a lot of sense, especially when multiple meta-data need to be read.
In your example, I see alternatives to reading annual daylight outputs, but can I do the same with point-in-time outputs?
 , way to export a HBJSON models (or Visualization Set objects generally) into HTML similar to the already implemented functionality in Pollination Outputs option highlighted here: