Hi @jakechevriersg! Thank you for sharing the code! You are very close.
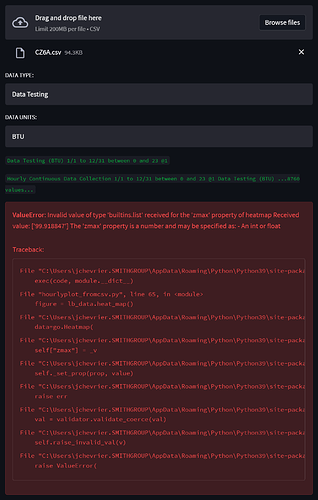
The only change that you need to make is to flatten the data that comes out of the CSV file and convert them to numbers.
    with open(csv_file, newline='') as f:
        reader = csv.reader(f)
        data = [float(item[0]) for item in list(reader)]
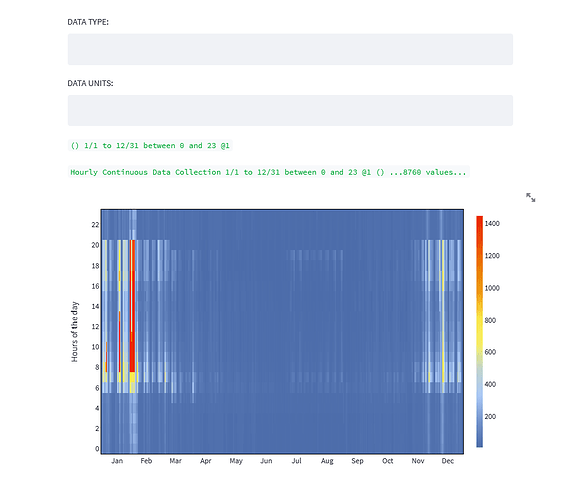
And then you’ll get what you are looking for. 


Here is the updated script:
import pathlib
import csv
import streamlit as st
from ladybug.header import Header
from ladybug.analysisperiod import AnalysisPeriod
from ladybug.datatype.generic import GenericType
from ladybug.datacollection import HourlyContinuousCollection


st.set_page_config(page_title='Testing Hourly Chart')


# Analysis Period ##################################################################
with st.sidebar:
    st.title('ANALYSIS PERIOD')
    st_month = st.number_input(
        'Start month', min_value=1, max_value=12, value=1, key='hourly_data_st_month')
    end_month = st.number_input(
        'End month', min_value=1, max_value=12, value=12, key='hourly_data_end_month')

    st_day = st.number_input(
        'Start day', min_value=1, max_value=31, value=1, key='hourly_data_st_day')
    end_day = st.number_input(
        'End day', min_value=1, max_value=31, value=31, key='hourly_data_end_day')

    st_hour = st.number_input(
        'Start hour', min_value=0, max_value=23, value=0, key='hourly_data_st_hour')
    end_hour = st.number_input(
        'End hour', min_value=0, max_value=23, value=23, key='hourly_data_end_hour')


# Upload CSV ##################################################################
csv_data = st.file_uploader('', type='csv')
if csv_data:
    csv_file = pathlib.Path(f'./data/{csv_data.name}')
    csv_file.parent.mkdir(parents=True, exist_ok=True)
    csv_file.write_bytes(csv_data.read())

    # Create LB Header ##################################################################
    datatype = st.text_input('DATA TYPE:')
    data_units = st.text_input('DATA UNITS:')

    lb_datatype = GenericType(datatype, data_units)
    lb_ap = AnalysisPeriod(st_month, st_day, st_hour,
                           end_month, end_day, end_hour)

    lb_header = Header(lb_datatype, data_units, lb_ap,)

    st.write(lb_header)

    # Read CSV and apply LB Header ##################################################################
    with open(csv_file, newline='') as f:
        reader = csv.reader(f)
        data = [float(item[0]) for item in list(reader)]

    lb_data = HourlyContinuousCollection(lb_header, data)

    st.write(lb_data)

    # Create Chart ##################################################################
    figure = lb_data.heat_map()
    st.plotly_chart(figure, use_container_width=True)
![]() …
…


