anujm1ttal
November 13, 2023, 10:26am
1
Hello All,
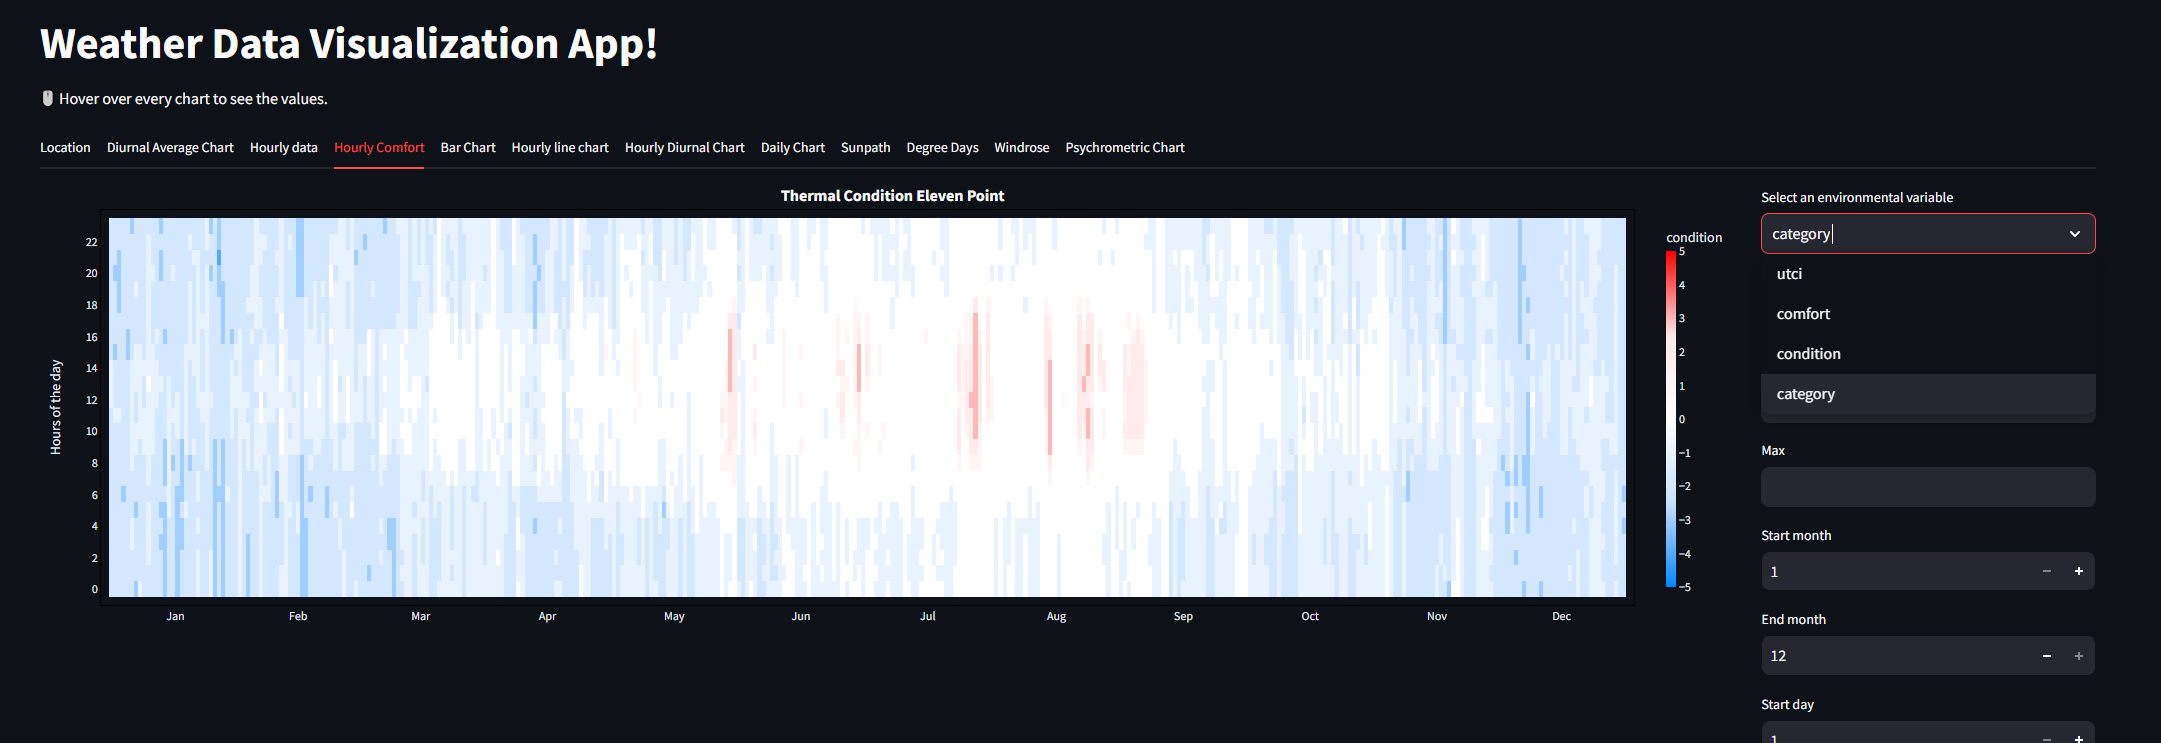
I am trying to add to the weather report sample app provided by you, I am able to add the comfort hourly heatmap to the app.
What i am wondering is that the legend segment text that get on the app is as per the data collection, which is from -5 to 5.
-5 = Extreme Cold Stress       (UTCI < -40)
-4 = Very Strong Cold Stress   (-40 <= UTCI < -27)
-3 = Strong Cold Stress        (-27 <= UTCI < -13)
-2 = Moderate Cold Stress      (-12 <= UTCI < 0)
-1 = Slight Cold Stress        (0 <= UTCI < 9)
 0 = No Thermal Stress         (9 <= UTCI < 26)
+1 = Slight Heat Stress        (26 <= UTCI < 28)
+2 = Moderate Heat Stress      (28 <= UTCI < 32)
+3 = Strong Heat Stress        (32 <= UTCI < 38)
+4 = Very Strong Heat Stress   (38 <= UTCI < 46)
+5 = Extreme Heat Stress       (46 < UTCI)
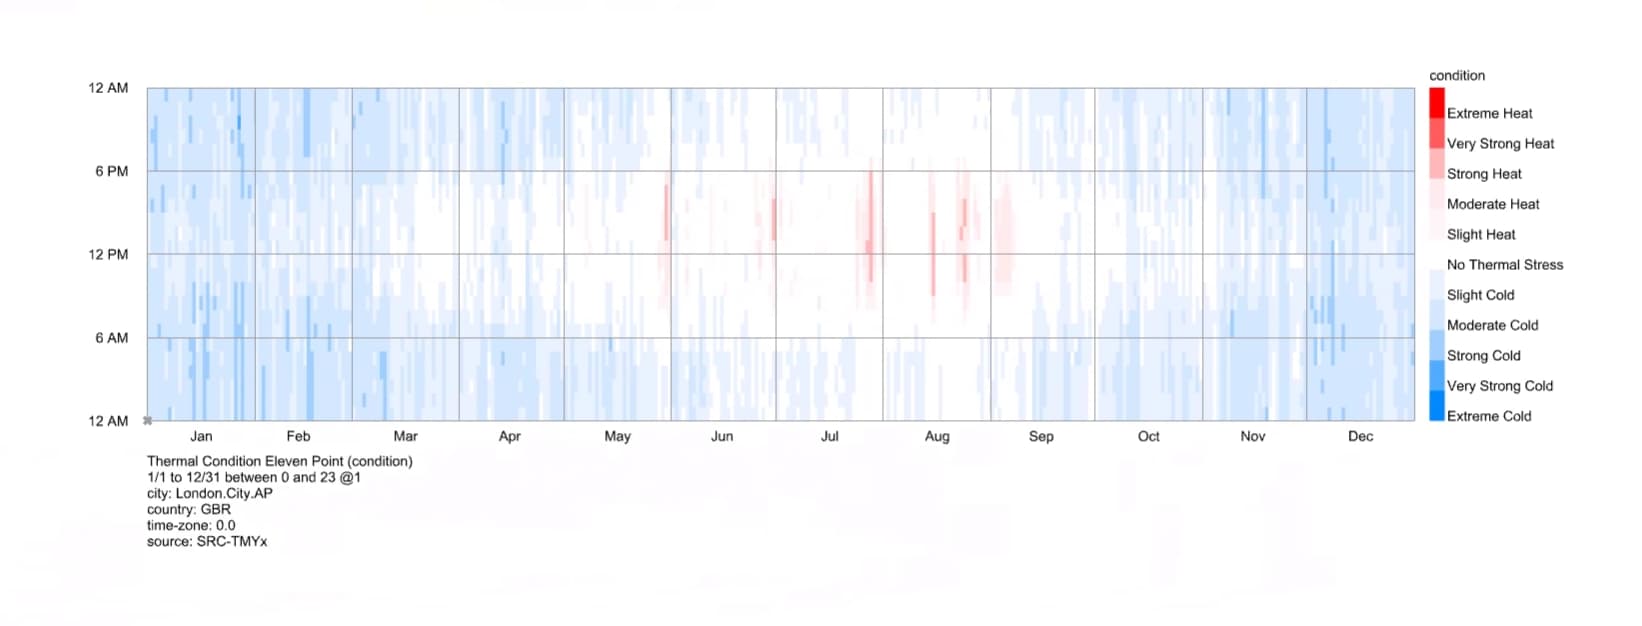
but in grasshopper it somehow translates these numbers to text as per the description as shown in the image below.
I have tried looking for this property, but I am not able to find it. Obviously I can just manually feed these values, but I am trying to find where it is in the SDK.
Please guide me to the right location. thanks.
mostapha
November 14, 2023, 1:12am
3
Hi @anujm1ttal , See this topic:
I have a workaround for you, @lucaslima , until we get the categorized legend parameters supported, which is to just convert all of the data into your visualization set into integers and then use the ordinal_dictionary of the normal LegendParameters to map the integers to text.
Here is a sample JSON file:
[image]
Ordinal_Legend.vsf (27.5 KB)
It’s a little more setup that you’ll have to do in the app. But, if you use this workaround, it should work with the current implementation in the Rhin…
anujm1ttal
November 14, 2023, 10:28am
5
Hi @mostapha ordinal_dictionary of the legend parameters. Its really neat.
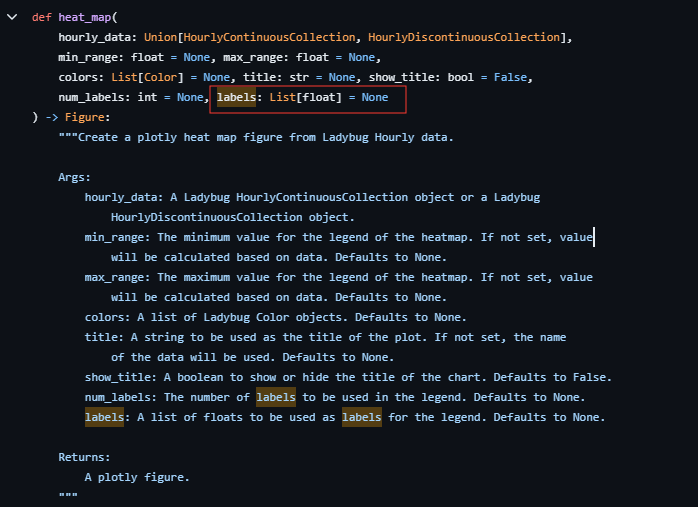
I think you have the type set as float instead of string for labels in the heatmap chart.
thanks
mostapha
November 14, 2023, 7:51pm
6
This is a question for @chriswmackey !
I’m not sure this is a question for me since I don’t know who wrote that code.
Could this be code that is in Ladybug Charts , @mostapha ?
mostapha
November 14, 2023, 8:19pm
8
Ah! Now that I see the question on a larger screen I see that this is related to ladybug-charts. I’m not sure if @devang remembers why that is set they way it is but you should feel free to edit the code as needed, @anujm1ttal . I also saw that you sent a PR that I didn’t have a chance to review yet! Thank you for that.
devang
November 14, 2023, 8:57pm
9
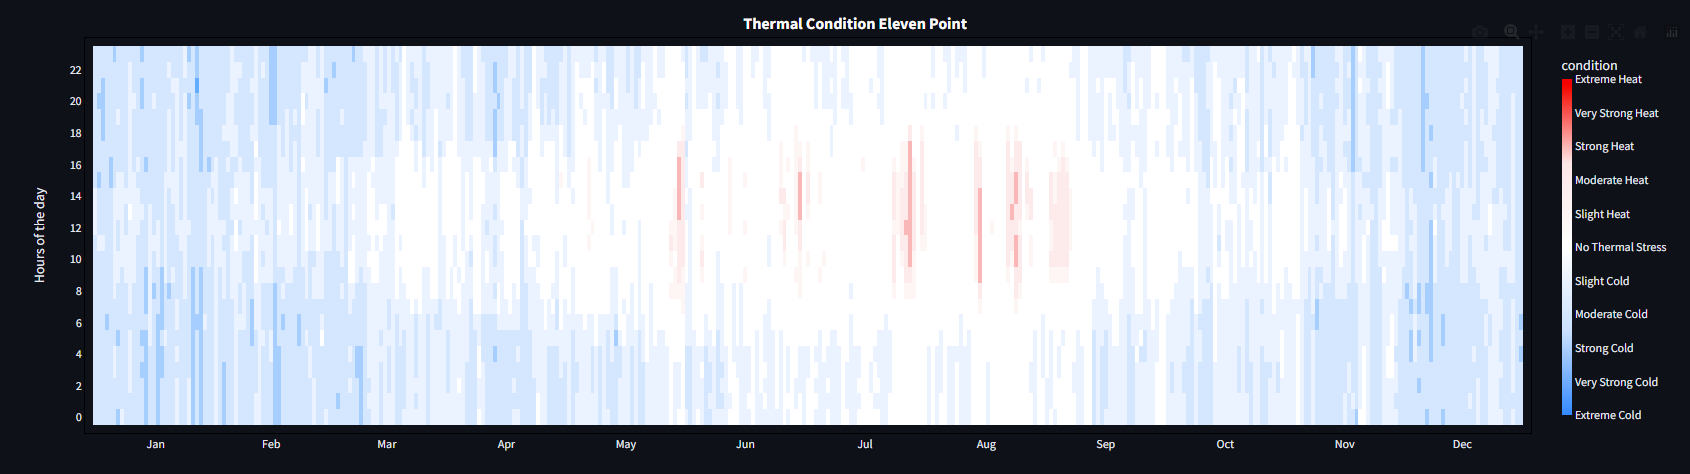
I didn’t know at the time that in Ladybug you directly get the categories shown in the Legend. I agree that would be better to show the categories directly.
anujm1ttal
November 15, 2023, 9:38am
10
@mostapha that PR is for windrose chart. its a feature to be able to rotate and change the number of directions in the windrose chart.
thanks for the hint, i will try and see if i can change the code in the dev version and send a PR for that as well.
anujm1ttal
November 15, 2023, 5:24pm
11
@mostapha sent a PR for heatmap as well.
Thanks